PSAT Redesign Brings Changes to National Merit Scores
National Merit cutoff scores have finally arrived, and our year of speculation is behind us. Thousands of students who had hoped their “1%” PSAT score would put them into National Merit contention are bound to be disappointed with the newly released score thresholds.
For reference, let’s look at the cutoffs for the PSAT that preceded the test’s redesign. That test had a score range of 60-240, a “Commended” score (which is good for particular scholarships) of 202 points and a mean National Merit cutoff score (which places students in contention for the National Merit scholarship and varies by state) of 212.7 points.
The Redesigned PSAT changed the potential score range (called the “Selection Index Score”) from 60-240 to 48-228. So it looked like everything was simply shifting down about 12 points. That math looked easy enough, so individuals speculated that National Merit scores for 2017 might look something like this:
When PSAT scores arrived in January, some schools anticipated a bonanza of National Merit kids, assuming the scholarship cutoffs would follow this same downward shift. But the recently released National Merit score cutoffs have shattered this illusion. The actual numbers look wildly different from the early estimates:
Forget the 12 point drop. Instead we are looking at a net rise of nearly 4 points for National Merit and a rise of 7 points for Commended! Of the 50 states and Washington DC, a mere six regions saw their cutoffs decrease, three saw no change, and the remaining 41 saw net increases. Our friends in California at Compass Prep compiled the scores into a nice table available here.
The 6 regions that saw drops in their NM cutoffs are as follows:
These five states and DC had scores that were already sky high. NJ and DC clocked in at 225, 15 points shy of a perfect 240 on the old test. It would have been an incredible feat for any state to post a cutoff score of 225 this year, a score that is only 3 points shy of perfection on the new scale!
Among the 41 states that saw increases, these states saw the biggest jumps:
We put together a heat map to show the most competitive states with the highest cutoff scores (deep red) and the less competitive states with lower cutoff scores (light peach).

The East and West coasts have always been hotbeds for high National Merit cutoff scores, but things are clearly heating up in Texas, which had an impressively high cutoff of 220.
Additionally, it’s worth noting that the spread of cutoff scores between states is more compressed with the new PSAT compared with the retired PSAT. The range of cutoff scores on the old PSAT varied by state from 202 to 225, a 23-point spread. Now, from the least to most competitive state, the range is 209 to 222, a 13-point spread. The new PSAT is seeing the cutoff scores tighten up between states, with less of a discrepancy in cutoffs between, say, D.C. and Mississippi.
What’s behind the change in cutoffs?
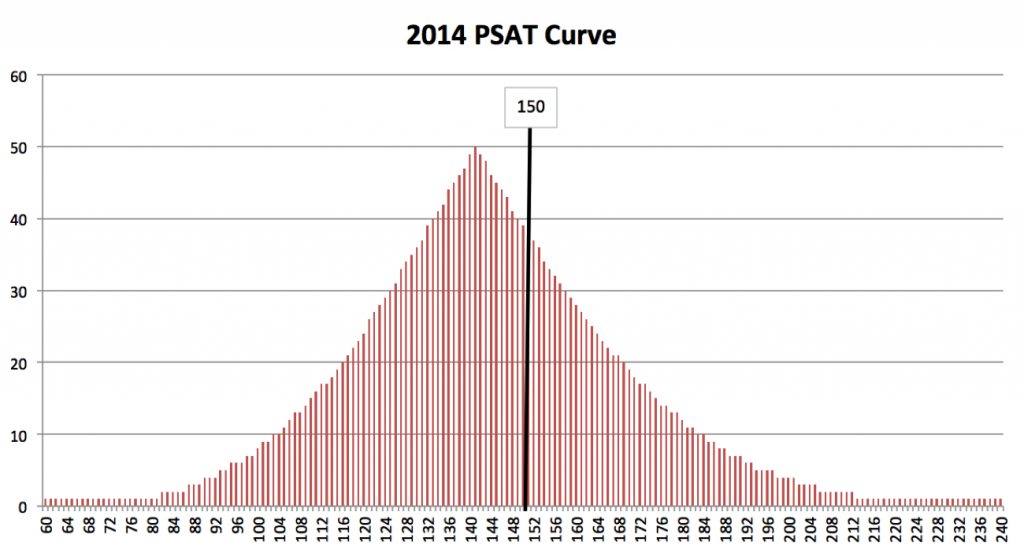
How did the score range shift down from 60-240 to 48-228 while the average National Merit cutoff shifted up? In short, these are completely different tests, on completely different curves. Compare the scoring distributions from the final “old” PSAT to the first redesigned PSAT:


Notice how the entire curve seems to have shifted to the right: the new PSAT curve has a massive “tail” on the left and the median score shifted to the right of the halfway point on the scale, compressing scores at the top of the distribution. Behind this shift is the elimination of the guessing penalty and the reduction in possible answer choices from five to four. In essence, students who blindly guess will get a slightly higher score than before while still being at the bottom of the distribution. This has long been true for the ACT, which has a similar “tail” in its score distribution.
Will there be a National Merit Bonanza across the country? No, there will not. The number of spots remains around 16,000, allocated proportionally by state population. The more populous states have proportionally more National Merit spots, while the particular cutoff scores will depend upon the performance of students in each state. Anecdotally, some school counselors with whom I’ve spoken have found that their schools are in fact having a small National Merit Bonanza. However, this indicates that their students are better prepared for the format and content of the redesigned PSAT, with its tighter Common Core alignment and reduced focus on geometry and advanced vocabulary.
We anticipate that as students get better acquainted with the redesigned PSAT, the heightened competition could cause cutoff scores to rise slightly in many states over the next few years. That being said, it is a reasonable inference that the scores for the upcoming PSAT in October will be within a few points of the current cutoffs for the 2015 PSAT.
Students who had sophomore PSAT scores within 10-15 points of the posted National Merit cutoff scores for 2017 should consider putting in some preparation to see if they can cross the cutoff threshold and be eligible for the National Merit scholarship. That one-time award of $2,500 can be leveraged for significant merit money at colleges across the nation. We’ve witnessed hundreds of students leverage their National Merit awards for highly discounted and even free tuition, making college far more affordable for their families. If you are close to one of those cutoff scores, some extra preparation could bring scholarship money within reach.
Questions? Need some advice? We're here to help.
.webp)

Take advantage of our practice tests and strategy sessions. They're highly valuable and completely free.

